Digital Marketing Analytics That Matter

Written by Matt Berringer
December 3, 2020
In digital marketing and content publishing, there is potential to gain complete visibility over the outcome of your efforts. When you post content on digitally optimized platforms, you can see everything from dwell time to which links your audience clicks. In the digital world, almost any audience action is quantifiable and trackable. As a result, you can probably find upwards of 50 metrics you could choose to focus on.
The catch is that not all these metrics have a real impact on your marketing success. Plenty make your marketing efforts seem effective — and impress some of your non-marketing colleagues — without saying much at all. It’s impossible to drive any real success focusing on so many possible metrics at once. The key to owning marketing’s impact is to choose the digital marketing metrics that matter most.
Your digital marketing key metrics will depend on your company’s goals. The analytics you track will also look different depending on your industry. A company looking to optimize costs will track different marketing metrics than one that wants to increase brand awareness. The metrics you use need to be accurate and drive decision making. They also need to focus on things the marketing department has a direct influence on. In other words, you should be able to improve your metrics. Let’s dive deeper into your digital marketing performance and how to track it effectively.
Learn more about:
- What Are Digital Marketing Metrics?
- Vanity Metrics vs. Value Metrics
- Digital Marketing Analytics Metrics
- How to Measure Digital Marketing Success
- Digital Marketing Analytics and Reporting Tools
- Understand Your Content Readership

What Are Digital Marketing Metrics?
Your digital advertising metrics are the specific values your marketing team uses as a yardstick for success. You’ll likely organize these data points into a digestible dashboard that lets you see progress over time. The key is to focus on metrics with a direct impact on revenue. While many metrics can quantify digital marketing success, some of the more common ones include:
- Traffic: This is a raw measure of how many visitors your website or content gets, including return and first-time visitors. Traffic can fluctuate from month to month, and in general, you want to see a slow, steady increase. Pay attention to any sharp declines.
- Engagement: Engagement is a broad metric measured in several ways. In general, engagement metrics quantify how much visitors interact with your content. It could encompass session time, clicks per visit or another measurement.
- Conversion rate: A small percentage of your page visitors will convert into leads or customers. This percentage represents your conversion rate.
- Dwell time: As an engagement metric, dwell time represents the average time a viewer spends on a page or website.
- Bounce rate: Another engagement metric, your bounce rate is the percentage of visitors who navigate away from your website without visiting another page. If your goal is to drive engagement and conversion, you want to lower your bounce rate.
- Customer acquisition cost: This is the amount of marketing investment it takes to convince someone to become a customer.
- Customer lifetime value: This estimates how much revenue each customer is likely to generate for a company.
- Click through rate: This relates specifically to digital advertising metrics. It represents the number of clicks an ad receives based on the number of views it has.
- Page views per session: These are the number of pages a visitor views each time they visit a website.
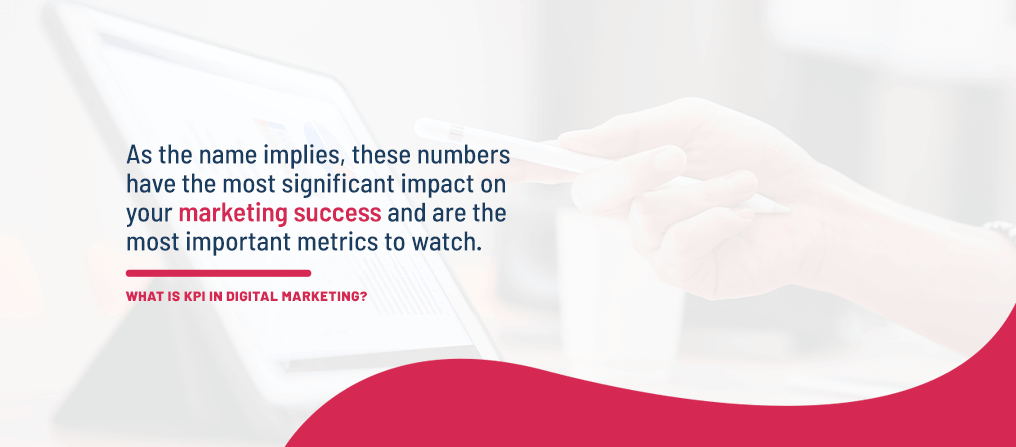
What Is KPI in Digital Marketing?
KPI stands for key performance indicator. As the name implies, these numbers have the most significant impact on your marketing success and are the most important metrics to watch. Among all your metrics, your KPIs represent your company’s vital signs. They’re generally tied to quantifiable goals. For example, to increase conversion rates from 1% to 3% over the next quarter.
Any department can use KPIs to track performance. For example, human resources might track employee retention rates. Your company might also have a set of KPIs related to business objectives. The KPIs you focus on in marketing should directly impact those enterprise-wide KPIs.
Most companies or departments choose to focus on four to 10 KPIs at a time, letting them hone in on those numbers. In digital marketing, you might set one KPI related to each arm of your digital marketing strategy. For example, you might want your social media channels to increase your reach. Meanwhile, you expect your content marketing to drive engagement.
How Do Digital Metrics Differ From Traditional Metrics?
Digital analytics for marketing tend to say more about your performance than traditional metrics. For example, imagine you mail a flyer to a group of existing and potential customers. You know how many you send, and how much it costs to send them, and not much else. You don’t know how many people looked at the flyer, much less whether it was a factor in swaying customers.
Let’s say your marketing team is running several campaigns at once, including the mailers, a TV commercial and some billboards. While your sales may climb, you won’t be able to attribute success to any one channel. In the digital world, you can attribute each cost directly back to a source. You know how many people open your emails, how many visit your website from a search result, and how many people become customers thanks to your marketing efforts.
Metrics are shifting in the digital world. For instance, in the magazine industry, the focus has shifted towards multi-channel engagement. Now, publishers need to consider more than their subscription and renewal rates. Instead, they’re focusing on page views per session, email signups, referral traffic and more.

Vanity Metrics vs. Value Metrics
When choosing which digital marketing metrics to track, you want your focus on valuable, revenue-impacting metrics. Tracking metrics out of your control and that don’t contribute to growth isn’t helpful. If your numbers fluctuate from month to month despite your efforts, your marketing team will appear ineffective. If your goals don’t correspond with boosted profits, you could stand to lose some of your marketing budget. So, your team needs to understand the difference between vanity metrics and value-driven metrics.
What Are Vanity Metrics?
Vanity metrics look good on paper without providing any real value to the big picture. While they might make you look like a successful marketer, they don’t have a tangible impact on revenue. They also don’t help you understand the success of your campaigns or whether you’re improving. For example, your number of subscribed users doesn’t say much. Knowing your subscriptions increased 5% over the past quarter lets you know your marketing aimed at unsubscribed users worked.
Many vanity metrics lack context. Site traffic tells you nothing without data about where the traffic comes from. Page views on a lead-magnet page only make sense within the context of how many people gave their contact information. Technically, any number can be a vanity metric. Your organization must define and track numbers based on how they influence revenue. Otherwise, your data analysis may be in vain.
Can Vanity Metrics Provide Any Value?
Sometimes, vanity metrics work well as a marketing tactic. Many companies advertise their subscriber count, their total downloads or some other metric as a form of social proof. A company’s lifetime number of hamburgers sold can certainly convince a hungry customer to stop for lunch. A brand’s number of Instagram followers might persuade a few more followers to join in.
One benefit of that “number sold to date” metric is even if your sales decline, the number still goes up. While the number will have little meaning to those in your company, it could impress your customers. Likewise, that number can look exciting to investors or even to other departments who don’t understand marketing. It can even be a point of pride and a morale-booster within your marketing team. Beyond that, vanity metrics don’t hold much value without the right context.
Understanding Value
Metrics become helpful when they are actionable, repeatable and generate value. Since any metric can be a vanity metric, it also holds true any metric can have value. Adding context and goals to a metric lets it represent more value and helps you improve. For example, site traffic in-and-of itself is a vanity metric. However, site traffic might translate into sales. The key is increasing relevant site traffic to the pages most likely to convince a reader to convert.
Picking valuable metrics requires an understanding of how a particular metric contributes to your return on investment (ROI). When you use metrics to measure your revenue-adding goals, they become useful.
Digital Marketing Analytics Metrics
In general, the metrics you should focus on can be divided among the upper, middle and bottom levels of your sales funnel.
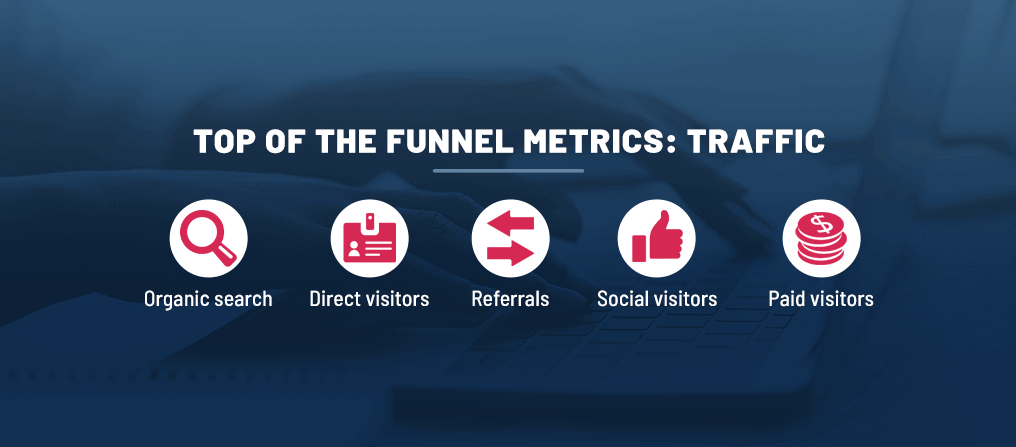
Top of the Funnel Metrics: Traffic
While increasing traffic for its own sake isn’t useful, it’s critical when you understand your buyers’ journeys. It’s likely many of your digital marketing strategies revolve around driving traffic to your website. Social media content, search engine marketing, email marketing and ads around the web all seek to drive traffic.To track your monthly visitors in a meaningful, actionable way, dive deeper with traffic-related metrics. To make sense of your raw traffic, you need to know where it’s coming from. This data sheds light on which marketing tactics are working. Your traffic sources may include:
- Organic search: This traffic comes from visitors who found your website through a search engine’s organic results. Your search engine optimization (SEO) strategy has the most impact on organic traffic.
- Direct visitors: Traffic from direct visitors accounts for users who typed your URL directly or visited your page from their bookmarks.
- Referrals: Some of your traffic comes from other websites with links to yours. Referral traffic may originate from guest blogs, paid referral links and any other sites that happen to link to your site.
- Social visitors: Any site traffic from your social media profiles or posts is social traffic.
- Paid visitors: This traffic comes from paid advertising. It includes pay per click (PPC) search engine marketing, paid ads and promoted content on other sites.
Looking at your traffic sources in proportion to each other and overall traffic tells you which marketing channels are most effective and where you can improve.
Another aspect of your traffic is your percentage of new and returning visitors. New visitors represent new introductions to your sales funnel, and returning visitors are ready to travel further down the funnel. New and returning visitors are both critical for growth. Ideally, your site will convert first-time visitors into your regular readers.
Another thing to look at with your traffic is how viewers access your content and where they come from geographically. You might have more international or mobile visitors than you realize. Understanding your visitors’ viewing context is less about tracking how your marketing is doing and more about optimizing the experience. For example, if you have many global or mobile visitors, it’s crucial to design content for these visitors.
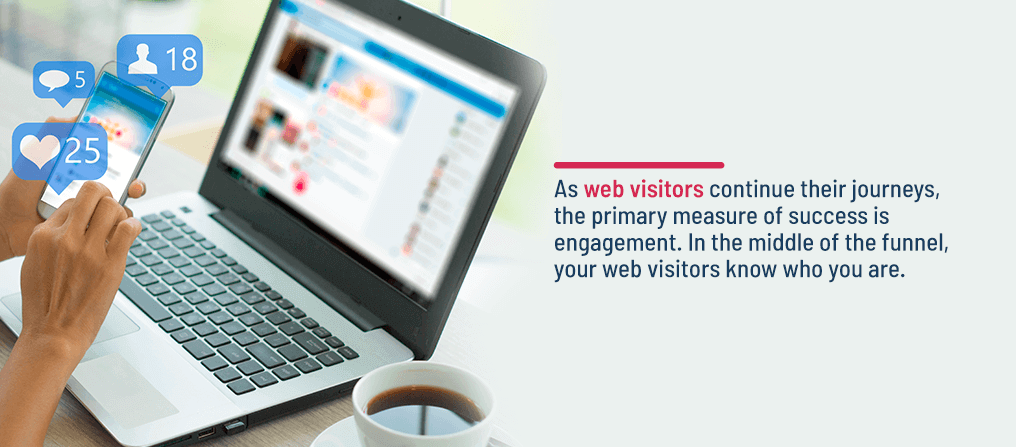
Middle of the Funnel Metrics: Engagement
As web visitors continue their journeys, the primary measure of success is engagement. In the middle of the funnel, your web visitors know who you are. The question is whether you keep them interested, so you eventually turn them into customers. Engagement builds relationships with your audience and leads them down to the bottom of the funnel.
You can measure engagement in several ways, including:
- Average time on site: This is a measure of how long a user spends on your site. Boosting your time per session can involve improving navigation, design or content quality. Many things can affect session time. For example, desktop users usually spend more time on a web page than mobile users who want answers quickly.
- Bounce rate: Your bounce rate is the percentage of visitors who leave your website after visiting one page. These visitors didn’t click on any other links or engage with your site in a more meaningful way. For the most part, you want users to engage longer with your site to increase their chances of becoming customers. A high bounce rate can also drive down your SEO search rankings. Sometimes, visitors bounce because they find what they need from a single page. Your content might need an extra push to convince users to keep learning or reading. Another cause of a high bounce rate is slow page load time and URLs that load a 404 error page.
- Net promoter score: Another way to gauge engagement and website satisfaction is by asking visitors if they are likely to recommend a company to a friend or colleague. You can calculate your net promoter score by sending a survey to website visitors, who rank their likelihood on a scale from zero to 10. Scores of zero to six represent your detractors, scores of seven to eight represent your passive visitors and scores of nine to 10 represent your promoters. Subtract your percentage of detractors from your share of promoters.
It’s crucial to set realistic engagement goals. Among the highest traffic digital news outlets, the average visitor spends 2.04 minutes per session. Depending on your industry or niche, you can expect a similar number. Take a baseline for your current engagement rates and set an attainable goal for improvement.
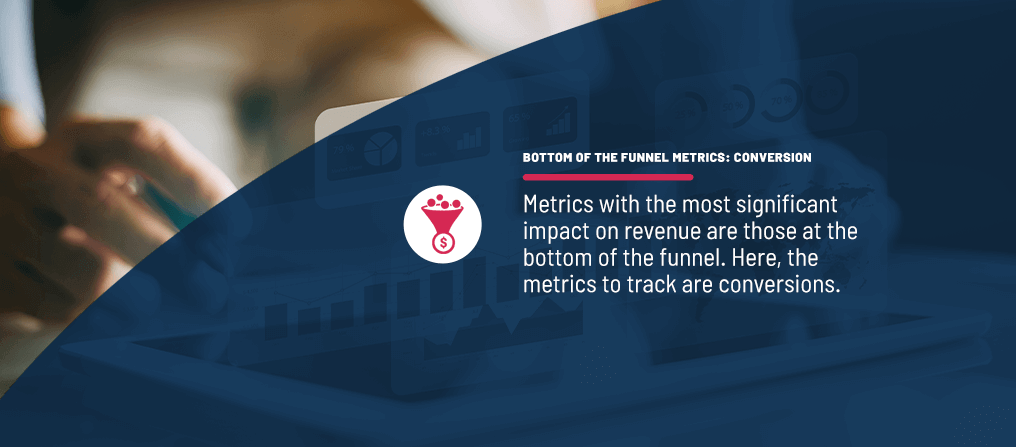
Bottom of the Funnel Metrics: Conversion
Metrics with the most significant impact on revenue are those at the bottom of the funnel. Here, the metrics to track are conversions. Conversions can be soft conversions, such as downloading gated content or filling out a contact form. They can also be hard conversions, counting those who sign up for services or checkout on an e-commerce site. Your conversion rate is the percentage of visitors who complete your goal action. As you dig into your internet marketing analytics, you might look at a few conversion metrics, like:
- Click-through rate (CTR): When it comes to paid advertising, a click is the desired action, and you usually pay by the click. Your CTR is the percentage of viewers who clicked on the ad.
- Cost per lead: When lead generation is the conversion goal, you want to understand your cost per lead acquisition.
- Cost per click (CPC): When you participate in PPC ad campaigns, the actual price you pay per click may vary. It can change based on your quality score, your competitors’ ad rank and your maximum bid.
Calculating ROI
While only 43% of B2B marketers measure ROI, 67% of top-performing B2B marketers do. Earning traffic, engagement and conversions come at an investment. If you’re managing your metrics right, those investments will lead directly to revenue. The question is, how much? Understanding your digital marketing ROI metrics will also require some revenue-based metrics, like:
- Customer acquisition cost (CAC): CAC accounts for all the costs associated with converting a customer, from the expense of attracting and keeping them through the cost of conversion. It’s the company’s total sales and marketing spend divided by the total sales from unique customers.
- Customer lifetime value (CLV): Your CLV tells you how much each customer will spend during their lifetime. It lets you know how much you can invest in both customer acquisition and retention. To find your CLV, multiply your average purchase value, the number of purchases made in a year and the average length of a customer relationship. This number tells you which clients are most profitable, which products are most valued by your high-CLV customers and more.
- CAC to CLV ratio: When you bring these two metrics together, you have an excellent approximation of your ROI. A proportion of 1:3 means every $1 spent on customer acquisition leads to $3 in value.
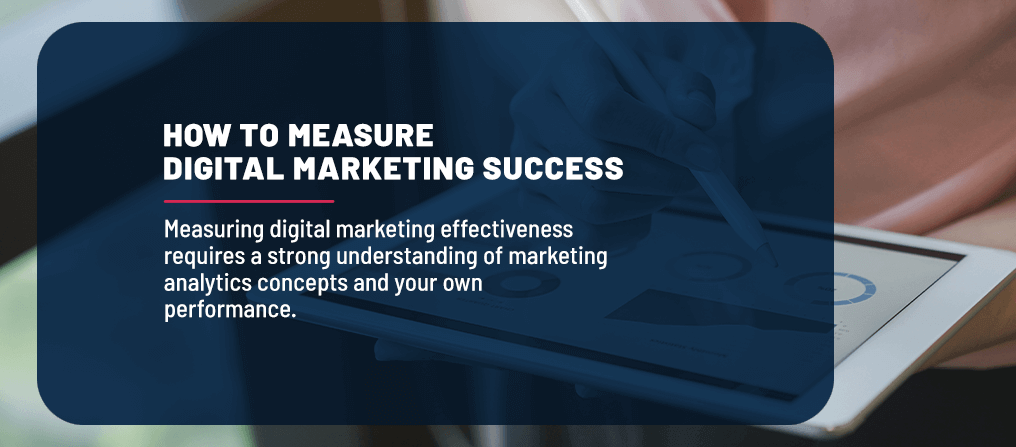
How to Measure Digital Marketing Success
Measuring digital marketing effectiveness requires a strong understanding of marketing analytics concepts and your own performance. Once you know where you stand, set goals for improvement based on your chosen KPIs. You’ll measure your success based on whether you meet your target KPIs.
Choosing Relevant KPIs for Your Industry
Marketing success looks different for everyone. The KPIs that make sense for your business depend on your industry. For example, dwell time is a big one for publishers because it shows how long a reader spends engaged with the content they produce. Another valuable KPI in the publishing industry is the click-through rate on advertisements within the publication since it helps sell ad space.
A marketing agency will need to track their clients’ ROIs since this proves their worth to their customers. An e-commerce site will look at conversion rates to see how their traffic translates into purchases. Travel and leisure content creators may look at which articles perform best in engagement. They might also look at their most-searched-for topics within their publications or search engines to get ideas for future content.
An excellent place to start as you select KPIs is by looking at your company-wide goals and deciding how marketing can contribute to them. Select a manageable number of KPIs to improve over a set period, such as a month, quarter or year.
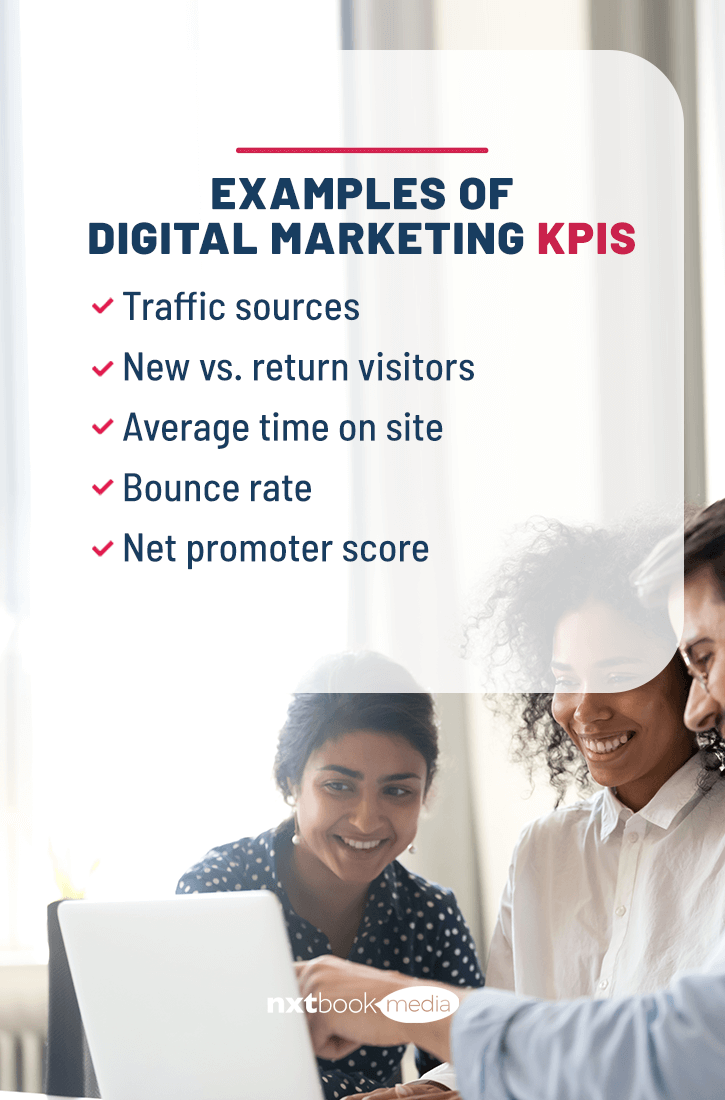
Examples of Digital Marketing KPIs
What KPIs should you aim for? The number can vary, so it’s essential to take a baseline for your own content and set goals based on your current performance. Here are some examples of attainable target KPIs across various metrics:
- Traffic sources: If you’re focused on SEO, most traffic should come from organic searches. It’s good to have a diversity of traffic sources, and you may want to increase your percentage of traffic from particular channels. If you have a higher conversion rate from organic search, you may aim to increase your organic search traffic from 60% to 70%.
- New vs. return visitors: The right ratio to aim for will depend on your business goals and your website’s age. A new website will probably have 80%-90% new traffic, which, as it matures, will convert into a 20%-30% return visitor ratio.
- Average time on site: A site with an average time on site of 3 minutes might want to increase session time to 5 minutes.
- Bounce rate: A site with a 28% bounce rate could aim for a target bounce rate of 20%.
- Net promoter score: These scores can fluctuate by industry. An online entertainment provider could reasonably take their score from +36 to +42. A travel website might go from +12 to +20.
Micro Conversion vs. Macro Conversions
Your conversion rate will probably be essential to focus on, no matter your industry. Broadly defined, a conversion is any desired action you set. It can represent a new visitor taking a step down to the middle of the sales funnel or an engaged user pulling the trigger to talk to a representative or checkout online. You may have different marketing campaigns geared toward visitors at various steps in the sales funnel, which require you to track different types of conversions. They include:
Micro conversions: A micro conversion is a small milestone on the way to future customer acquisition. While they may not have an impact on revenue right now, they might in the future. A newsletter subscription, an e-book download or a free account setup can all be micro conversions.
Macro conversions: Macro conversions impact revenue. Contacting a salesperson, requesting a demo or placing an online order are all forms of macro conversions.
Digital Marketing Analytics and Reporting Tools
Once you pick your KPIs, you need a way to measure and make sense of them. That’s where your suite of digital marketing analytics tools comes in. They could include:
- Google Analytics: If you want to know how your website is performing, you need Google Analytics. It’s a free service with paid options for more sophisticated analytics and data. Google Analytics can track all the actions taken by site visitors, where they come from and many customizable metrics.
- Search engine ranking tools: If you’re focused on SEO, you likely want to see how many keywords you rank for and what your ranking for each page is. Many tools out there can show you your rankings and compare you to your competitors.
- Social media analytics: While you can see how much traffic your social media channels bring in on your web analytics platform, you may want to see metrics related to your social media posts. Your social media profiles should have built-in analytics, and you can find paid tools that give you more advanced insights.
- Digital publishing platform analytics: Whether you publish gated content, a digital edition or free white papers, you want to see how your content engages readers. How many pages are they viewing, and how long are they interacting with the content for? When you publish content online via PDFs, your readers enter an analytics dead zone. When you use a digital publishing platform, all this data is accessible for tracking and analysis.
- Marketing KPI dashboard software: Your KPI dashboard is where data science meets digital marketing. It lets you see all your metrics and KPIs from across data sources in real-time. Many software applications can do this, each offering different data sources.

Understand Your Content Readership With PageRaft by Nxtbook Media
Content published through PageRaft boasts an average of seven minutes of engagement per session. How do we know? Our trusted data and detailed analytics, which you can access when you develop and host content on PageRaft. It’s an excellent solution for digital publishers, enterprise marketers and marketing agencies who need to dive deep into their content performance. To learn more about how you can make your content stand out and your metrics accessible, schedule a PageRaft demo today.